Structured Financial Data Partners Behind AI Research APIs
Data quality, not model sophistication, determines AI research accuracy.
An AI financial research API can write a clean, well-cited answer and still be wrong, because the accuracy of that answer was decided before the model ever started reasoning. The quality, schema discipline, and freshness of the data feeding the system determine how well its output holds up, independent of the elegance of the prompt or the sophistication of the model. This is a garbage-in, garbage-out problem, but it runs at infrastructure scale: one weak data partner can corrupt every downstream answer that touches that data type, across every user, every day it stays connected.
Consider an agent asked whether a chipmaker's infrastructure spending is paying off. To answer that question honestly, the agent needs filings text describing the capital outlay, reported financials showing what actually got spent, earnings call commentary explaining management's reasoning, market data showing how investors reacted, and recent news capturing anything that happened since the last filing. Each of those is a different category of information, sourced from a different kind of provider, updated on a different schedule. A model can reason carefully across all five and still produce a confidently wrong answer if the financials it pulled in were six months stale or the filing excerpt was pulled from the wrong fiscal period.
A cited figure, a filing excerpt, a macro indicator: each is only as trustworthy as the partner that supplied it. Sound reasoning layered on top of stale or malformed data does not produce a correct answer. It produces a plausible one, and plausible is a dangerous word in financial research, because a wrong answer with a citation attached is often harder to catch than a wrong answer with none.
The data partner ecosystem behind an AI research API is not plumbing sitting quietly underneath the product. It functions as the actual intelligence layer, and the research API itself works mainly as an orchestration surface, choosing which partner to call, when, and how to reconcile what comes back. Everything that follows in this piece, the evaluation questions, the layered architecture, the specific providers, exists to unpack that one claim and show what it means in practice.
Data partner requirements for AI financial research agents
Financial dashboards built for human analysts and AI agent workflows demand fundamentally different things from a data partner, even when they pull from the same underlying source. A dashboard assumes a person is reading the output, scanning a chart, skimming a filing, applying judgment to fill gaps. An agent has no such judgment to fall back on unless the data itself carries the structure needed to reason correctly. That difference shapes what counts as a usable data partner long before anyone picks an API.
Five questions help separate a data partner that works for agent workloads from one that merely works for people. Can the partner locate a particular section inside a filing, rather than just handing back a link to the filing as a whole? Does a financial figure arrive with its reporting period and units attached, or does the agent have to guess which quarter and which currency it belongs to? Can structured numbers and the management narrative that explains them come back from the same call, or does the agent have to stitch two separate retrievals together and hope they line up? How quickly does a new filing or a revised data series show up in the feed once it exists? And if the agent writes a research memo based on what it pulled, can a reader actually trace each claim back to the document it came from?
Most traditional APIs fail several of these tests by design, because they were built to hand back raw JSON or raw filing text and let the caller figure out the rest. The agent has to decide what to retrieve, pull out the passages that matter, and reconcile whatever conflicts turn up between sources. Each of those steps is a place where a small mistake in retrieval becomes a bigger mistake in extraction and a bigger one still in reconciliation.
The real dividing line is architectural. A data partner that returns retrieval and structured data in the same call, the exact section of a filing alongside the balance sheet as clean JSON, dated and traced back to the primary source, has already done the work an agent would otherwise have to do on its own. That single design choice, bundling retrieval with structure rather than handing back one or the other, is close to the clearest signal available for whether a data partner was actually built with agent workloads in mind.
The three functional layers a financial AI research stack requires from its data partners
Once those five questions are on the table, the data partner ecosystem behind any serious financial research API sorts itself into three functional layers. A gap at any one layer does not stay contained. It travels forward into every answer the agent produces downstream. Mapping the layers matters more than evaluating any single provider in isolation.
The first layer covers market and fundamental data: structured numbers keyed to a ticker, an identifier, or an economic series. This is where live and historical prices live, along with fundamentals, financial statements, ratios, macro indicators, and the quantitative analysis built on top of them. What this layer cannot do is answer questions about why a company did something, what a regulatory filing says, or any conclusion that requires reasoning across multiple sources. Numbers alone do not explain themselves.
The second layer covers filing and document retrieval: the raw content of filings, earnings transcripts, press releases, news articles, company websites, and patents. This is where the narrative lives: the explanation behind the numbers. But retrieval alone does not answer a question either. Finding the right document is only the first step. Locating the specific passage inside a hundred-page filing that actually bears on the question asked is the harder problem, and raw retrieval APIs generally leave that problem for the agent to solve on its own.
The third layer is research synthesis: reports that connect the first two layers together, built with citations and supporting files attached. This is where the follow-through happens, where an agent can check whether revenue growth actually tracked the spending in question, what management said caused it, and whether two companies being compared are even reporting on the same period. Synthesis is poorly suited to live prices or simple lookups where milliseconds matter more than careful cross-referencing.
These three layers describe jobs that need doing, not exclusive categories that map neatly onto individual vendors. A single provider may cover more than one layer at once, and a working financial research stack almost always combines several providers to cover all three. The next three sections walk through each layer in turn, starting with the one that sits closest to the primary source: regulatory filings themselves.
SEC filings and XBRL facts: the primary filing layer
SEC EDGAR functions as the non-negotiable foundation for any financial research stack focused on US companies, because it is the only source of filing text and reported XBRL financial facts that comes straight from the primary record rather than a secondhand summary of it. Anything built on top of EDGAR inherits that authority. Anything that skips it loses the one layer a reader can actually trace a claim back to.
EDGAR's APIs give developers direct access to filing histories, company facts, and financial concepts as structured data rather than as a wall of unformatted text. The XBRL financial facts returned through these APIs matter because they carry their reporting period and units along with them. That metadata is what lets an agent compare a revenue figure from one company to a revenue figure from another, or compare the same company across two fiscal years, without quietly misattributing a number to the wrong period or the wrong currency.
But EDGAR has a clear ceiling, and it stops at exactly the place where interpretation begins. It cannot locate a specific passage buried inside a filing. It cannot reconcile figures that show up differently across two related filings. It cannot reason about what management said relative to what the numbers show. All of that work falls to the agent, or to another layer in the stack built to handle it.
Timing matters here too. New filings appear in EDGAR after a company submits them, but there is a real gap between the moment something material happens and the moment a processed, retrievable EDGAR entry reflects it. A production agent answering time-sensitive questions has to account for that window rather than assume the feed is instantaneous.
What EDGAR does provide is the place where verifiable, cited financial AI output actually starts. An agent that cannot trace a claim back to a specific section of a specific filing cannot pass the basic test laid out earlier: can a reader check this. EDGAR returns documents and structured facts, not conclusions, and that limit is why a separate synthesis layer, covered above as the third functional layer, needs to exist.
Market data and fundamentals providers: the structured numbers layer
Market data and fundamentals providers form the quantitative backbone of a financial research stack, supplying the price history, company fundamentals, and macro indicators that the filing layer cannot. But raw numbers only help an agent if they arrive with the right metadata attached: the ticker they belong to, the reporting period they cover, the units they're measured in, and the adjustment method used to calculate them. Without that metadata, a number has no context, and an agent cannot safely compare it against a figure from a different provider or a different filing period.
Alpha Vantage covers market time series, technical indicators, and endpoint-driven financial analysis across global stocks, ETFs, mutual funds, options, indices, forex, crypto, commodities, and economic indicators. Its free tier covers most endpoints at 25 requests per day, though real-time US market data and certain premium endpoints require a paid plan starting at $49.99 a month, and that daily cap makes the free tier impractical for any agent trying to scan across multiple markets in a single session.
Finnhub supplies US and global market data along with alternative data, and its free tier allows 60 requests per minute, a meaningfully looser limit than a flat daily cap. Paid plans start at $49.99 a month, billed quarterly.
EODHD focuses on end-of-day data, offering one year of free history across more than 70 exchanges and over 150,000 tickers, with paid plans starting at $19.99 a month. The breadth of exchange coverage makes it a useful option for cross-market queries, even though the free tier is limited to historical end-of-day prices rather than live data.
Twelve Data covers global stocks, forex, and crypto, with a free tier capped at 8 requests per minute and 800 requests per day. Paid plans start at $29 a month, positioning it as one of the lower-cost entry points among these providers.
Intrinio covers US fundamentals, prices, and options, and offers a free trial through its Developer Sandbox rather than an ongoing free tier. Paid plans start at $150 a month, reflecting its focus on fundamentals depth over free-tier access. All of these figures reflect pricing checked as of September 23, 2026, and providers change pricing and limits often enough that any number here should be confirmed directly before building against it.
Schema discipline is not an abstract concern. When a fundamentals provider hands back a revenue figure without attaching the reporting period, the currency, and the adjustment method used to calculate it, an agent has no safe way to compare that number against a figure from another provider or from a different filing period. The resulting error does not announce itself. It sits quietly inside a memo until a human auditing the output catches it, by which point the agent has already presented it as a settled fact.
Many of these providers now offer MCP servers alongside their standard APIs, but an MCP server does not by itself remove rate limits or usage constraints. When an MCP server simply forwards requests into the same REST API underneath, the same rate limit, the same API key requirement, and the same per-request cost all carry through unchanged. Shibui Finance's own architecture analysis makes this point directly: an API-forwarding MCP server translates a model's request into the same calls a developer would make by hand, so wrapping an API in an MCP layer does not solve the constraints of the API itself. That distinction, between a data partner that merely adds an MCP interface and one that changes the underlying architecture, sets up the alternative covered next.
The pre-loaded database architecture as an alternative for cross-market AI queries
For an AI agent running a query that touches thousands of tickers at once, the standard per-request API model starts to break down, because that architecture was never designed for batch reasoning at that scale, regardless of how strong any individual provider is. A model asking one question about one company fits comfortably inside a single API call. A model comparing valuation trends across a few thousand companies in one pass does not, and forcing that workload through a per-request system built for one-off lookups runs straight into the same rate limits and per-call costs described in the previous section, just multiplied by the number of tickers involved.
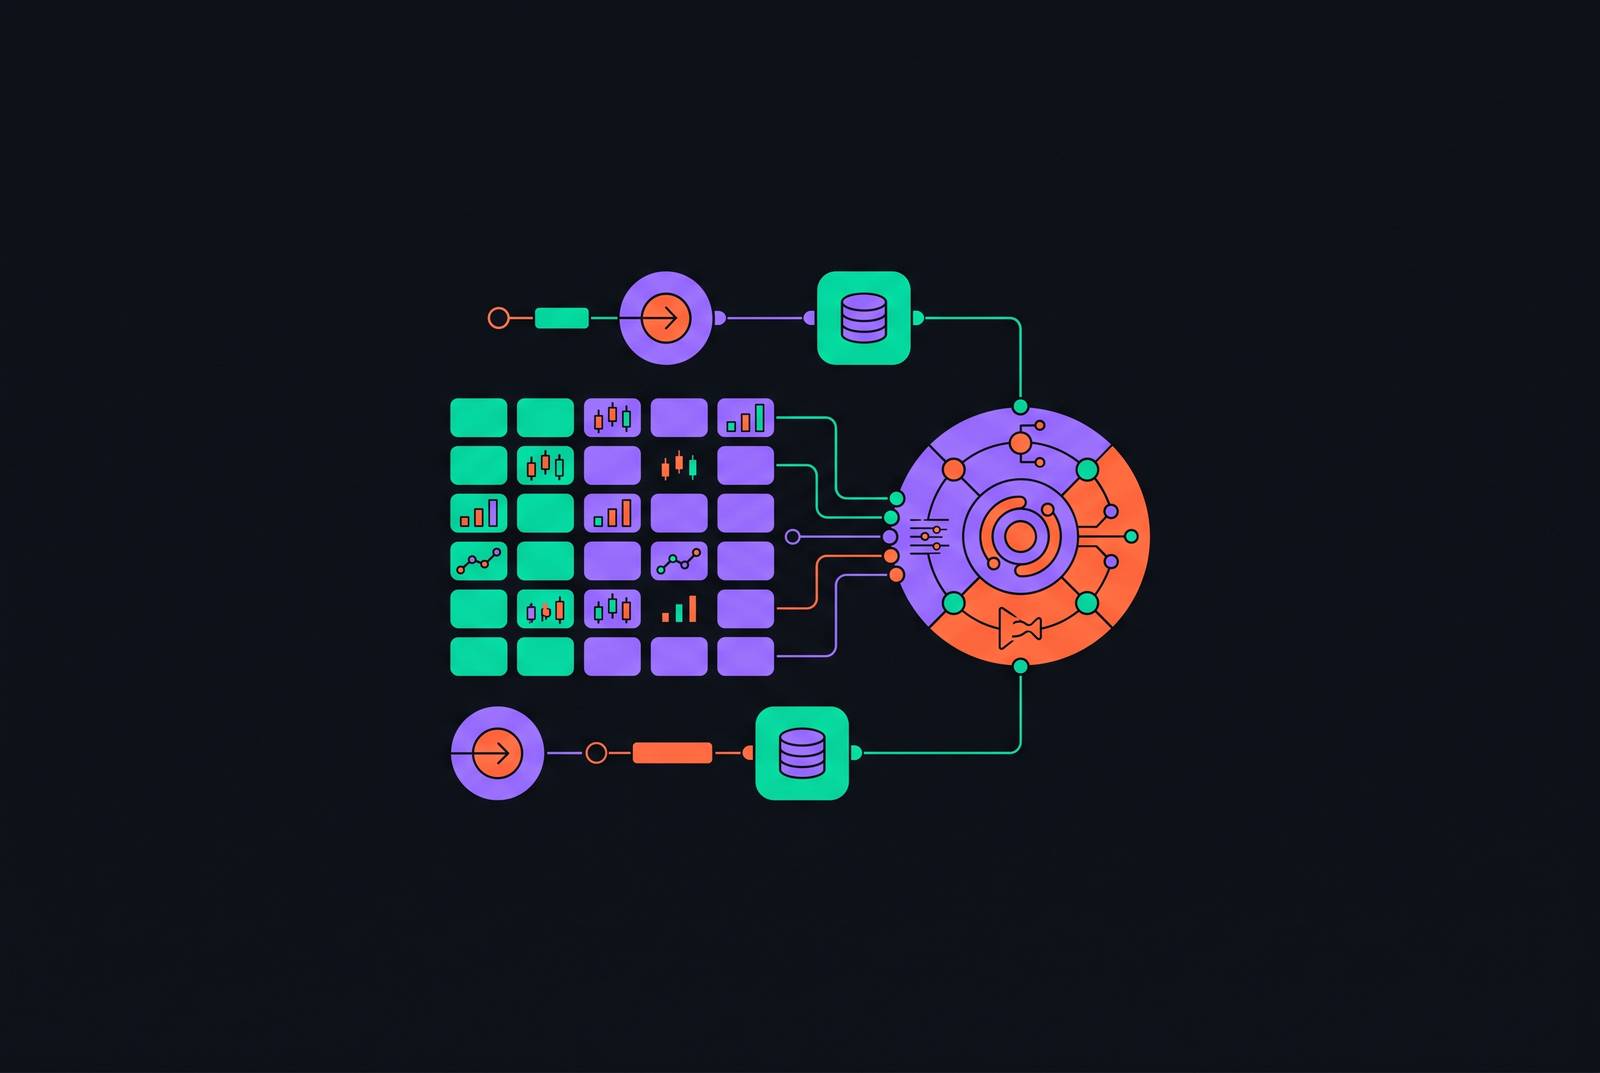
Shibui Finance represents an alternative approach to this problem: a pre-loaded database architecture, where the relevant market and fundamentals data sits ready inside a system built for bulk querying, rather than requiring a fresh API call for every single ticker an agent wants to examine. The tradeoff embedded in that choice is the same tension that runs through this entire piece: freshness against breadth. A pre-loaded database can serve a cross-market query instantly because the data is already sitting there, but it depends on how recently that data was refreshed, while a live per-request API call guarantees a fresh pull at the cost of speed and scale.
Neither approach wins outright: an agent answering a single, time-sensitive question about one company's latest filing benefits from a live, per-request pull straight from a primary source like EDGAR. An agent scanning valuation metrics across an entire sector benefits far more from a pre-loaded architecture that can return results across thousands of tickers without hitting a rate limit built for one ticker at a time. Building a financial research stack means choosing, deliberately, which of those two problems the agent is actually trying to solve, because no single architecture optimizes for both at once.